
Who and What is Ada?
More information on who Ada Lovelace was, what the Ada monitoring station is,
and the meaning of the water quality parameters it measures.
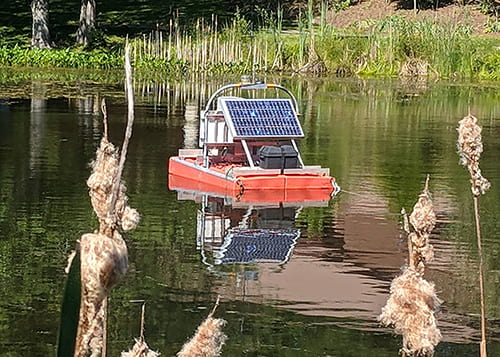
You may have landed here because our “Ada Data” text-bot sent you, or because you are puzzling over that orange, solar powered, floating raft in Choate Pond on the Pace University Pleasantville campus. (It’s not an algae-eating machine.)
 Welcome! We are here to explain.
“Ada” is our first deployment in a coming series of real-time water monitoring stations that will compose the Choate Smart Pond Network on the Pace University campus in Pleasantville, NY. Every fifteen minutes, it collects water quality measurements from the pond and sends them to a central campus computer located in Elm Hall. Blue CoLab uses that data to evaluate the pond, and create apps, products and presentations to deepen public understanding of water.
Why “Ada?”
 Our Ada monitoring station is named for Ada Lovelace, regarded as the first computer programmer. Born in 1815, she collaborated with the celebrated mathematician Charles Babbage on his proposed invention, the Analytical Engine, “a highly advanced mechanical calculator often considered a forerunner of the electronic calculating computers of the 20th century.” But Ada envisioned Babbage’s invention as capable of operations even beyond his imaginings, describing “the possibilities of programming the machine to go beyond number-crunching to ‘computing’ in the wider sense in which we understand the term today.” *
She wrote that Babbage’s invention “might act upon other things besides numbers… the Engine might compose elaborate and scientific pieces of music of any degree of complexity or extent.” — a startling insight for the early 19th century. She died at 37, leaving us only to wonder where her extraordinary talent would have taken her.
For Ada Lovelace’s innovative thinking, and groundbreaking vision, we proudly named our first water monitoring station in her honor.
* J. Fuegi and J. Francis, “Lovelace & Babbage and the creation of the 1843 ‘notes’,” in IEEE Annals of the History of Computing, vol. 25, no. 4, pp. 16-26, Oct.-Dec. 2003, doi: 10.1109/MAHC.2003.1253887.
Temperature
Every aquatic species has a preferred water temperature essential to its survival in rivers, lakes and ponds. Temperatures that rise too far above or below a preferred temperature can have devastating effects on populations. The shock of excessive temperatures can kill organisms outright, or cause areas of hypoxia (lack of oxygen) that result in events such as fish kills. In New York State, environmental regulations require that if a waterbody reaches 90 degrees all activities that contribute warmed water to that waterbody be halted. Warm water holds less dissolved oxygen than cool water, and may not contain enough for the survival of different species. In addition, higher temperatures can cause the proliferation of bacteria, viruses and parasites; dissolve minerals from surrounding rock or from the geology in underground water sources; and increase the toxicity of some chemical compounds present in the water itself or in particles suspended in a water body.
Read More: https://www.usgs.gov/special-topics/water-science-school/science/temperature-and-water
Dissolved Oxygen

Although water molecules contain an oxygen atom, this oxygen is not what is needed by aquatic organisms living in natural waters. A small amount of oxygen is actually dissolved in water. It enters the pond mainly from the atmosphere and, but also from groundwater and the stream that feeds the pond north of the library. This dissolved oxygen is needed by fish and other water organisms to survive. Cold water can hold more dissolved oxygen than warm water. In winter and early spring, when the water temperature is low, the dissolved oxygen concentration tends to be high. In summer and fall, when the water temperature is high, the dissolved-oxygen concentration is often lower. Low oxygen concentration, known as hypoxia, is dangerous to aquatic life. But so too is a high concentration, exceeding 110%, which can be caused by excessive vegetation and algae.
Read More; https://www.usgs.gov/special-topics/water-science-school/science/dissolved-oxygen-and-water
Salinity

The contamination of a fresh waterbody with salinity, or salt, can ruin habitat, negatively affect organisms, and even permanently alter an aquatic ecosystem — if sediments in the pond’s bottom trap high concentrations of salt. Pond water can have an abundance of suspended and dissolved particles or solids. Many of those dissolved solids can be salts, due to a water body’s action on the minerals in surrounding rock or the underlying geology where ground water resides. But more worrisome is salt contamination due to runoff from highways, parking lots, and sidewalks where road salt has been used for de-icing in winter, sometimes excessively – an increasing problem in communities across the nation that experience winter conditions. Because the presence of salts, or salinity, makes water a better conductor of electricity, we can calculate the relative salinity of the pond by monitoring the conductivity of its water.
Read More: https://www.usgs.gov/special-topics/water-science-school/science/saline-water-and-salinity
pH

“pH” is a measure of whether water is acidic, basic or neutral, on a range of 0 to 14. Neutral is 7. Below 7 begins an acidity scale and above 7 begins a base scale. For example, typical household vinegar is acidic, measuring between 2 -3. Meanwhile, laundry detergent is basic, measuring 10. In a pond, proper pH levels assure the solubility and biological availability of nutrients essential to the health of pond life. A waterbody should be self-regulating for pH. However, external influences, such as pollution, watershed runoff, and acid precipitation can affect pH, with adverse consequences for the ecosystem. For example, when pH drops below, or rises above, a range of 6.5 – 9, fish and other organisms can become stressed, fail to thrive, even die. In addition, metals tend to be more toxic at lower pH because they are more soluble the more acid the water. In Flint Michigan, acidic water from the Flint River mobilized lead from pipes and delivered it to residents’ home taps.
Read More: https://www.usgs.gov/special-topics/water-science-school/science/ph-and-water
Turbidity

Turbidity is the measure of the relative clarity of water. The greater the suspended particles, the higher the level of turbidity and the cloudier the water. High concentrations of particles affect light penetration and therefore ecological productivity and habitat quality. Turbidity readings can be used as an indicator of potential pollution. The same conditions that cause high turbidity can promote regrowth of pathogens, such as bacteria and viruses, leading to waterborne disease outbreaks. Some pollutants , such as metals, insoluble toxins, and bacteria can attach themselves to suspended particles. PCBs in the Hudson River are an example. Not soluble in water, PCB molecules attached themselves to suspended particles in the Hudson, a very turbid body of water. Because particles can settle and collect on the bottom, large areas of the Hudson’s bottom became highly contaminated.
Read More: https://www.usgs.gov/special-topics/water-science-school/science/turbidity-and-water